The website has been slow for some time. I think it is because of increased disk-io.
In this post:
- FreeBSD 12.0
- PostgreSQL 11.5
- LibreNMS does the graphs via SNMP
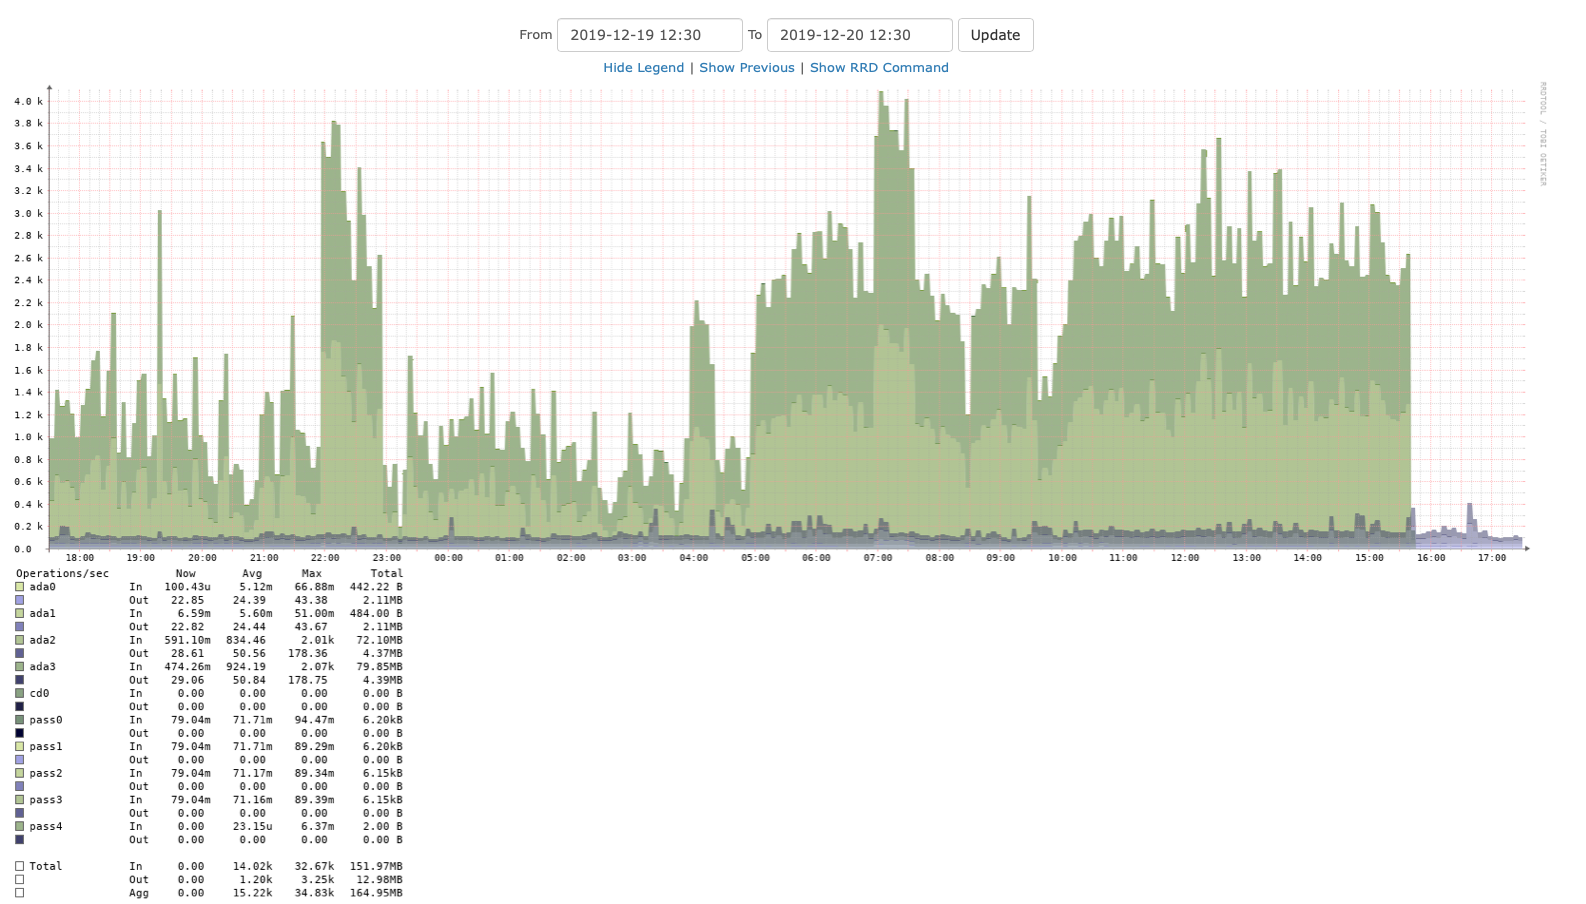
The diskio overall
By increased, I mean it has gone from about 0.1k to about 1.6k, peaking to 140-150. This is steady and persistent.
This graphs shows the jump which occurred earlier this year.
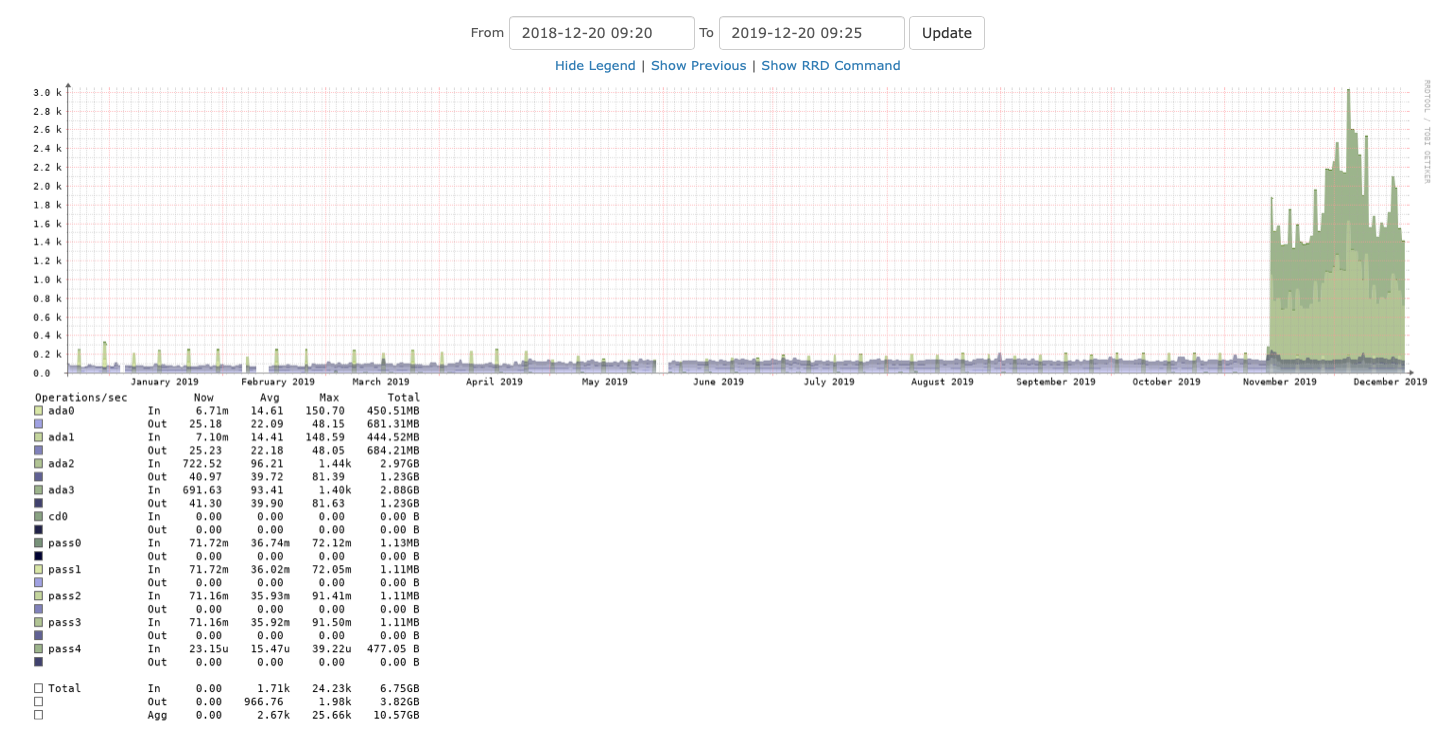
My eyes can’t tell for sure which two drives are involved, but going to the graphs for individual drives, it is clearly ada3 and ada2.
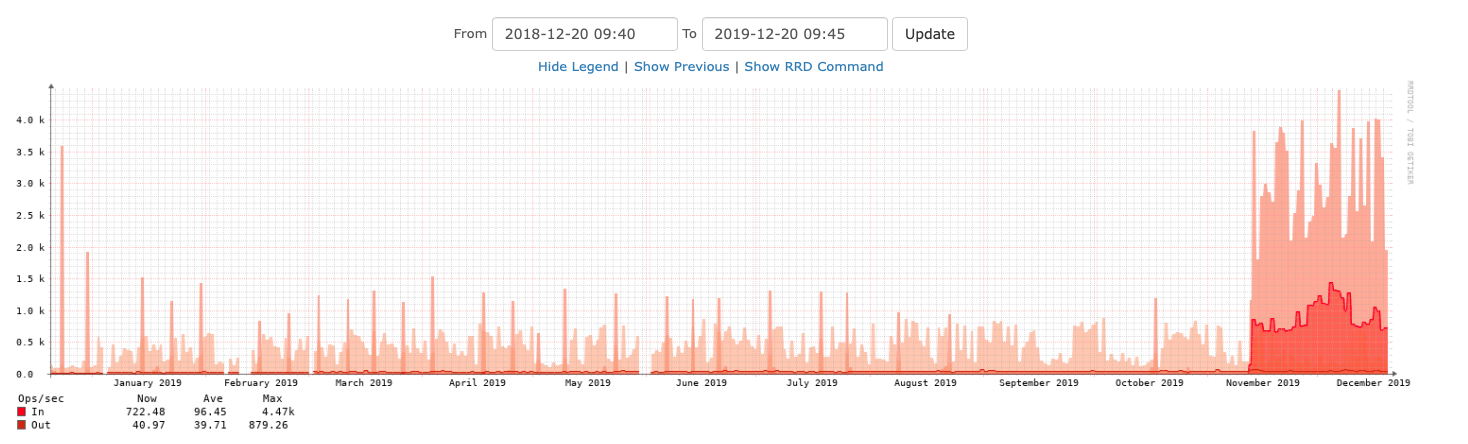
ada2
This is for ada2:
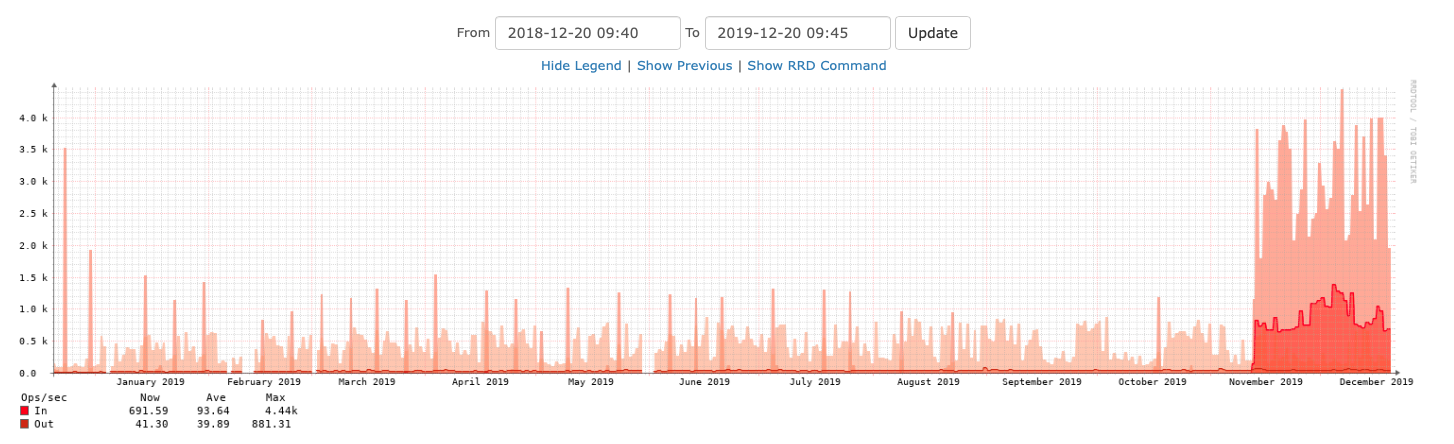
ada3
And the same period for ada3:
zroot
zpool status confirms this is the zroot pool.
$ zpool status
  pool: main_tank
 state: ONLINE
status: Some supported features are not enabled on the pool. The pool can
	still be used, but some features are unavailable.
action: Enable all features using 'zpool upgrade'. Once this is done,
	the pool may no longer be accessible by software that does not support
	the features. See zpool-features(7) for details.
  scan: scrub repaired 0 in 0 days 02:43:45 with 0 errors on Wed Dec 18 06:32:53 2019
config:

	NAME        STATE     READ WRITE CKSUM
	main_tank   ONLINE       0     0     0
	  mirror-0  ONLINE       0     0     0
	    ada0p1  ONLINE       0     0     0
	    ada1p1  ONLINE       0     0     0

errors: No known data errors

  pool: zroot
 state: ONLINE
status: Some supported features are not enabled on the pool. The pool can
	still be used, but some features are unavailable.
action: Enable all features using 'zpool upgrade'. Once this is done,
	the pool may no longer be accessible by software that does not support
	the features. See zpool-features(7) for details.
  scan: scrub repaired 0 in 0 days 00:04:40 with 0 errors on Thu Dec 19 03:10:19 2019
config:

	NAME        STATE     READ WRITE CKSUM
	zroot       ONLINE       0     0     0
	  mirror-0  ONLINE       0     0     0
	    ada2p3  ONLINE       0     0     0
	    ada3p3  ONLINE       0     0     0

errors: No known data errors
The filesystems
What’s on there?
[dan@x8dtu:~] $ zfs list -r zroot
NAME                                    USED  AVAIL  REFER  MOUNTPOINT
zroot                                  26.8G  78.8G    96K  /zroot
zroot/ROOT                             5.92G  78.8G    96K  none
zroot/ROOT/default                     5.92G  78.8G  4.19G  /
zroot/TESTING                           616K  78.8G    88K  /zroot/TESTING
zroot/TESTING/top                       528K  78.8G    88K  /zroot/TESTING/top
zroot/TESTING/top/test1                  88K  78.8G    88K  /zroot/TESTING/top/test1
zroot/TESTING/top/test2                  88K  78.8G    88K  /zroot/TESTING/top/test2
zroot/TESTING/top/test3                  88K  78.8G    88K  /zroot/TESTING/top/test3
zroot/TESTING/top/test4                  88K  78.8G    88K  /zroot/TESTING/top/test4
zroot/TESTING/top/test5                  88K  78.8G    88K  /zroot/TESTING/top/test5
zroot/data                             20.8G  78.8G    88K  /zroot/data
zroot/data/dan-pg                        88K  78.8G    88K  /usr/home/dan/pg
zroot/data/freshports                  4.51G  78.8G    88K  none
zroot/data/freshports/repo             4.51G  78.8G    88K  none
zroot/data/freshports/repo/PORTS-head  4.51G  78.8G  4.51G  /iocage/jails/x8dtu-ingress01/root/var/db/freshports/ports-jail/var/db/repos/PORTS-head
zroot/data/ingress01-testing            675M  78.8G   675M  /iocage/jails/x8dtu-ingress01/root/usr/home/dan/tmp-fast
zroot/data/pg01-postgres               15.6G  78.8G  15.6G  /iocage/jails/x8dtu-pg01/root/var/db/postgres
zroot/data/pg02-postgres               9.25M  78.8G  9.25M  /iocage/jails/x8dtu-pg02/root/var/db/postgres
zroot/tmp                               120K  78.8G   120K  /tmp
zroot/usr                               192K  78.8G    96K  /usr
zroot/usr/src                            96K  78.8G    96K  /usr/src
zroot/var                              9.77M  78.8G    96K  /var
zroot/var/audit                          96K  78.8G    96K  /var/audit
zroot/var/crash                          96K  78.8G    96K  /var/crash
zroot/var/log                          8.48M  78.8G  8.48M  /var/log
zroot/var/mail                          120K  78.8G   120K  /var/mail
zroot/var/tmp                           912K  78.8G   912K  /var/tmp
[dan@x8dtu:~] $
What is likely to have the traffic?
- zroot/data/freshports/repo/PORTS-head – that’s the man FreeBSD ports repo
- zroot/data/pg01-postgres – the PostgreSQL database server (pg02 is another database server, but not used)
- caching – I added caching on disk for some of the web pages. If anything, this should reduce the disk io.
- recordsize – I changed some parameters on both zroot/data/pg01-postgres and zroot/data/pg02-postgres
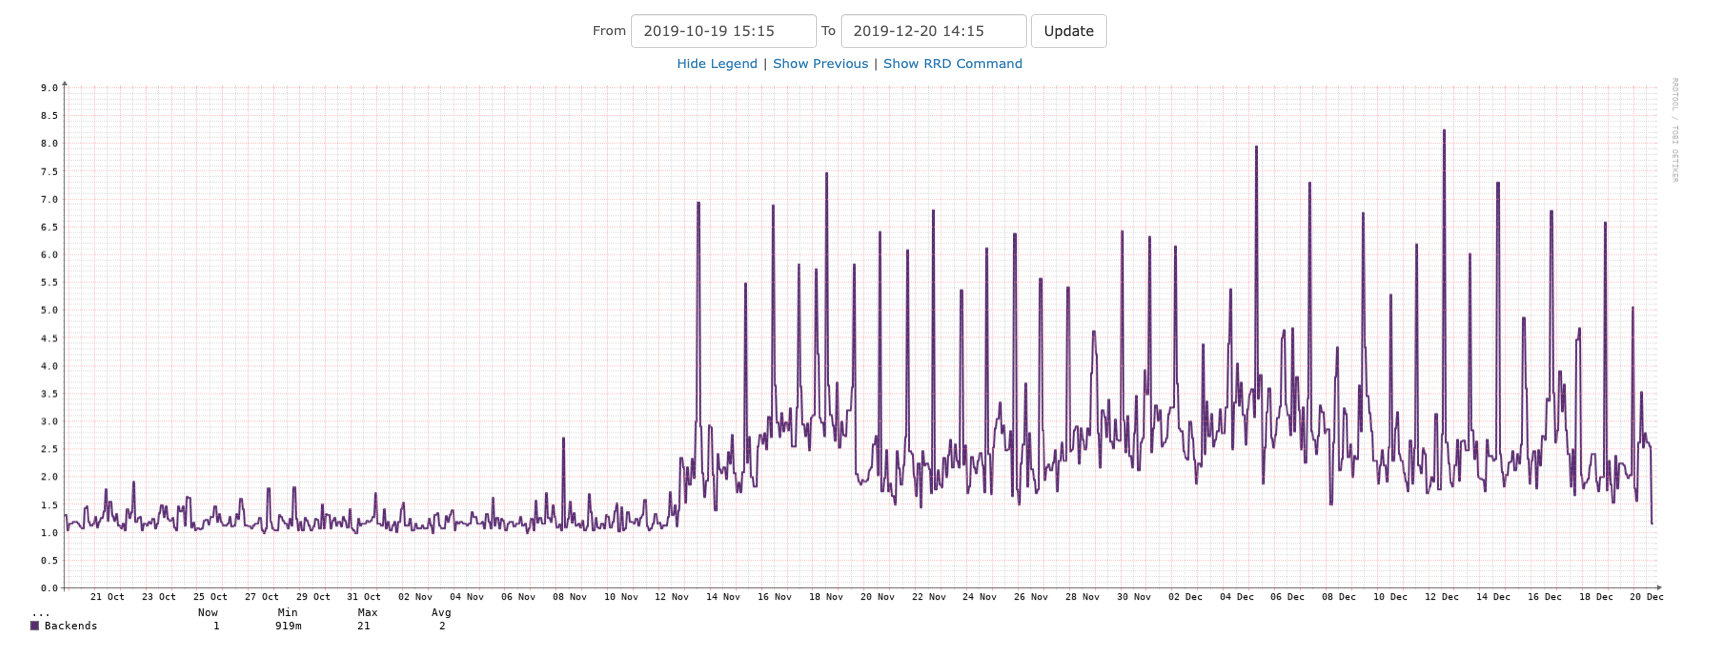
PostgreSQL backends
The average number of PostgreSQL backends has jumped from about 1 to 3. This is the PostgreSQL pg01 jail.

What changed?
Two things come to mind:
Looking back at command history, I see:
[dan@x8dtu:~] $ history | grep recordsize
    7  zfs get recordsize,redundant_metadata,primarycache,logbias zroot/data/pg01-postgres postgres                                  11.6M  63.2G  9.18M  /iocage/jails/x8dtu-pg02/root/var/db/postgres
    8  zfs get recordsize,redundant_metadata,primarycache,logbias zroot/data/pg01-postgres zroot/data/pg02-postgres
    9  sudo zfs set recordsize=8k              redundant_metadata=most              primarycache=metadata              logbias=throughput zroot/data/pg01-postgres zroot/data/pg02-postgres
   10  zfs get recordsize,redundant_metadata,primarycache,logbias zroot/data/pg01-postgres zroot/data/pg02-postgres
  496  history | grep recordsize
These are the current settings for pg01, the current production database server:
[dan@x8dtu:~] $ zfs get recordsize,redundant_metadata,primarycache,logbias zroot/data/pg01-postgres
NAME                      PROPERTY            VALUE         SOURCE
zroot/data/pg01-postgres  recordsize          8K            local
zroot/data/pg01-postgres  redundant_metadata  most          local
zroot/data/pg01-postgres  primarycache        metadata      local
zroot/data/pg01-postgres  logbias             throughput    local
[dan@x8dtu:~] $
Looking at the parent, these are the likely settings before the change:
[dan@x8dtu:~] $ zfs get recordsize,redundant_metadata,primarycache,logbias zroot/data
NAME        PROPERTY            VALUE         SOURCE
zroot/data  recordsize          128K          default
zroot/data  redundant_metadata  all           default
zroot/data  primarycache        all           default
zroot/data  logbias             latency       default
[dan@x8dtu:~] $
What changed?
- recordsize – from 128K to 8K
- redundant_metadata – from all to most
- primarycache – from all to metadata
- logbias – from latency to throughput
top
An extract from top shows:
 pid: 43619;  load averages:  1.01,  1.39,  1.48           up 34+18:05:39  15:19:57
195 processes: 9 running, 186 sleeping
CPU:  1.9% user,  0.0% nice,  6.5% system,  0.0% interrupt, 91.6% idle
Mem: 338M Active, 720M Inact, 102G Wired, 85G Free
ARC: 62G Total, 48G MFU, 8620M MRU, 3603K Anon, 759M Header, 5407M Other
     47G Compressed, 117G Uncompressed, 2.47:1 Ratio
Swap: 4096M Total, 4096M Free
Lots of free RAM (85G).
Plenty of ARC in use (62G).
Theories
Could the change in recordsize cause this issue? Some records are now 128K, some are 8K?
If yes, then shutting down the database, and zfs send | zfs recv the entire dataset to a new dataset would make everything 8K.
The jump in number of backend workers, could that be because queries now take longer and requests from the websites are now over lapping?
If the cause is one or a combination of redundant_metadata, primarycache, and logbias, changing them back and observing might show a difference.
Setting changes
The following commentary is based on a IRC chat with Allan Jude.
primarycache=metadata means that ZFS will cache only the ZFS metadata, not any PostgreSQL database data. The idea behind this configuration is to have no ZFS data in the ARC, thereby avoiding both PostgreSQL and ZFS caching the same data twice. However, we might be better off letting ZFS cache this data, since the dataset is only 15.6GB and it will all fit into ARC compressed.
logbias=throughput tells ZFS to optimize for throughput. This will not do synchronous writes to the ZIL. This will make commits to the database take longer. Setting this back to latency is probably better for a database.
At about Fri Dec 20 15:38 UTC 2019, I ran: zfs set primarycache=all zroot/data/pg01-postgres
To speed up the caching, I ran this command:
[dan@x8dtu:~] $ sudo zfs snapshot zroot/data/pg01-postgres@for.caching
[dan@x8dtu:~] $ sudo zfs send zroot/data/pg01-postgres@for.caching > /dev/null
[dan@x8dtu:~] $ sudo zfs destroy zroot/data/pg01-postgres@for.caching
[dan@x8dtu:~] $
That will read all the dataset into ARC.
PostgreSQL database settings
This is what PostgreSQL is working with:
shared_buffers = 128MB
That is spread rather thinly for a 15.6GB database.
A a wise person recently said: the key to database performance with ZFS is you need exactly one of [database|filesystem] caching the database. 0 of them caching or both of them caching is bad. In years past I’ve had better luck letting the database cache than ZFS caching. But that was before compressed ARC.
20 minutes later
Now the graph is trending down. This is the past 6 hours.
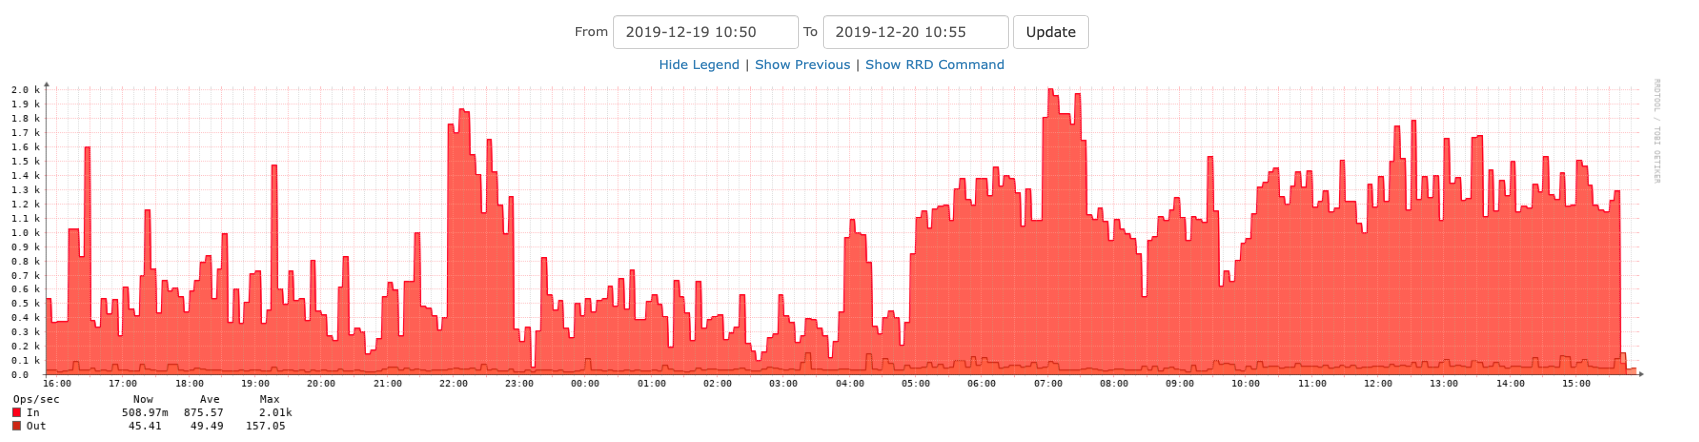
Nearly two hours later
Yes, I declare this fixed. The overall diskio has dropped back to what it was before the change.
The number of PostgreSQL backends has also dropped.
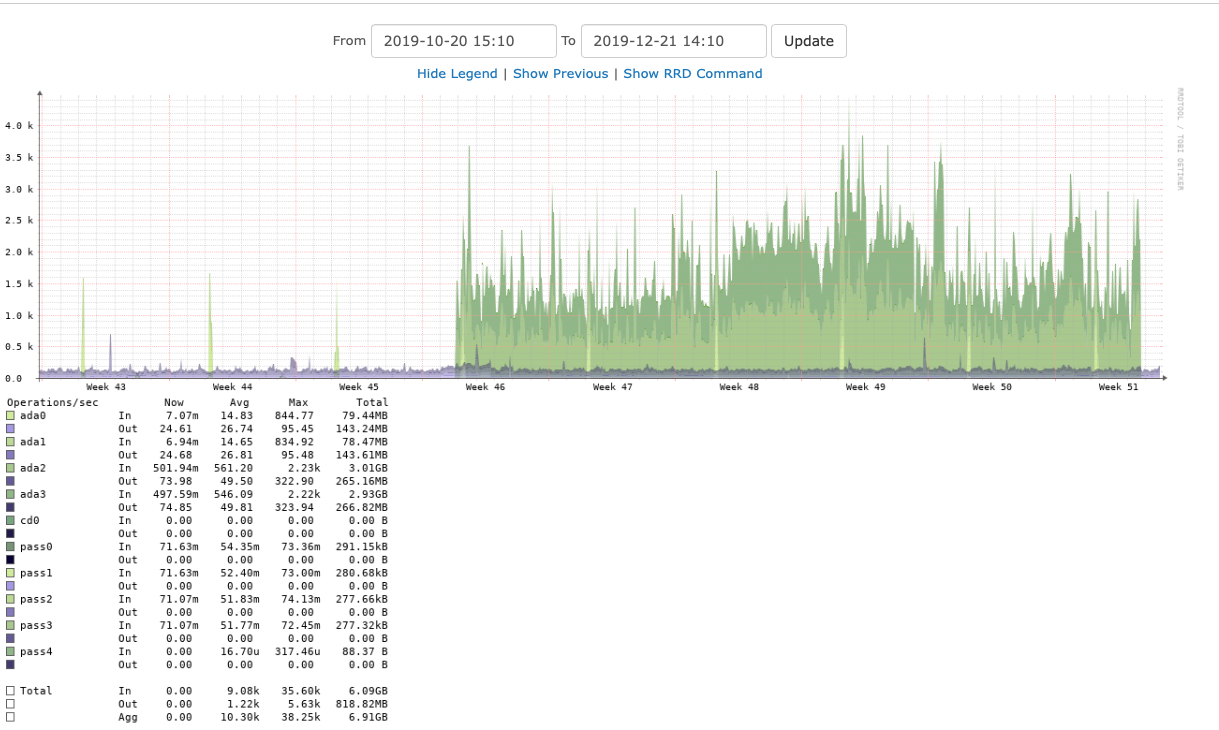
28 hours later
I waited until the next day to include this graph. It clearly shows how the IO has dropped back to the same level as before. This graph covers a two-month period.
Thanks
Sorry it took so long to get to. Glad I had Allan and Josh to help out.


