Today at about 1:00 pm Philadelphia time, the website went offline. It was still there, it just could not answer any queries.
In this post:
- Website and database server running in AWS
- FreeBSD 12.2 on a
- t3.medium
EC2 instance - PostgreSQL 12.5 running on a db.t2.large RDS instance
Initial look
Looking at load, it was acceptable:
$ w
 7:09PM  up 43 days, 20:48, 1 user, load averages: 0.12, 0.26, 0.30
USER       TTY      FROM                                      LOGIN@  IDLE WHAT
ec2-user   pts/0    [redacted]                                7:09PM     - w
There were a lot of php-fpm: pool www (php-fpm) processes running.
Looking in the logs, I found:
[root@nginx01 /var/log]# tail -F php-fpm.log
[29-May-2021 17:41:34] WARNING: [pool www] seems busy (you may need to increase pm.start_servers, or pm.min/max_spare_servers), spawning 16 children, there are 17 idle, and 224 total children
[29-May-2021 17:41:41] WARNING: [pool www] seems busy (you may need to increase pm.start_servers, or pm.min/max_spare_servers), spawning 8 children, there are 19 idle, and 234 total children
[29-May-2021 17:41:43] WARNING: [pool www] seems busy (you may need to increase pm.start_servers, or pm.min/max_spare_servers), spawning 16 children, there are 17 idle, and 235 total children
[29-May-2021 17:41:44] WARNING: [pool www] seems busy (you may need to increase pm.start_servers, or pm.min/max_spare_servers), spawning 32 children, there are 18 idle, and 238 total children
[29-May-2021 17:41:45] WARNING: [pool www] seems busy (you may need to increase pm.start_servers, or pm.min/max_spare_servers), spawning 32 children, there are 18 idle, and 240 total children
[29-May-2021 17:41:46] WARNING: [pool www] seems busy (you may need to increase pm.start_servers, or pm.min/max_spare_servers), spawning 32 children, there are 19 idle, and 242 total children
[29-May-2021 17:41:51] WARNING: [pool www] seems busy (you may need to increase pm.start_servers, or pm.min/max_spare_servers), spawning 8 children, there are 18 idle, and 249 total children
[29-May-2021 17:41:55] WARNING: [pool www] server reached pm.max_children setting (250), consider raising it
[29-May-2021 18:02:26] WARNING: [pool www] child 12962 exited with code 70 after 1759.560106 seconds from start
[29-May-2021 18:02:26] NOTICE: [pool www] child 22023 started
^C
Yeah, that’s a lot.
Looking at the RDS statistics, it was busy at about 98% load I think, I did not take a screen shot then. But here is the screen shot in hindsight, showing the fast build up of the number of sessions, from near zero to 250 and staying there for 2.5 hours
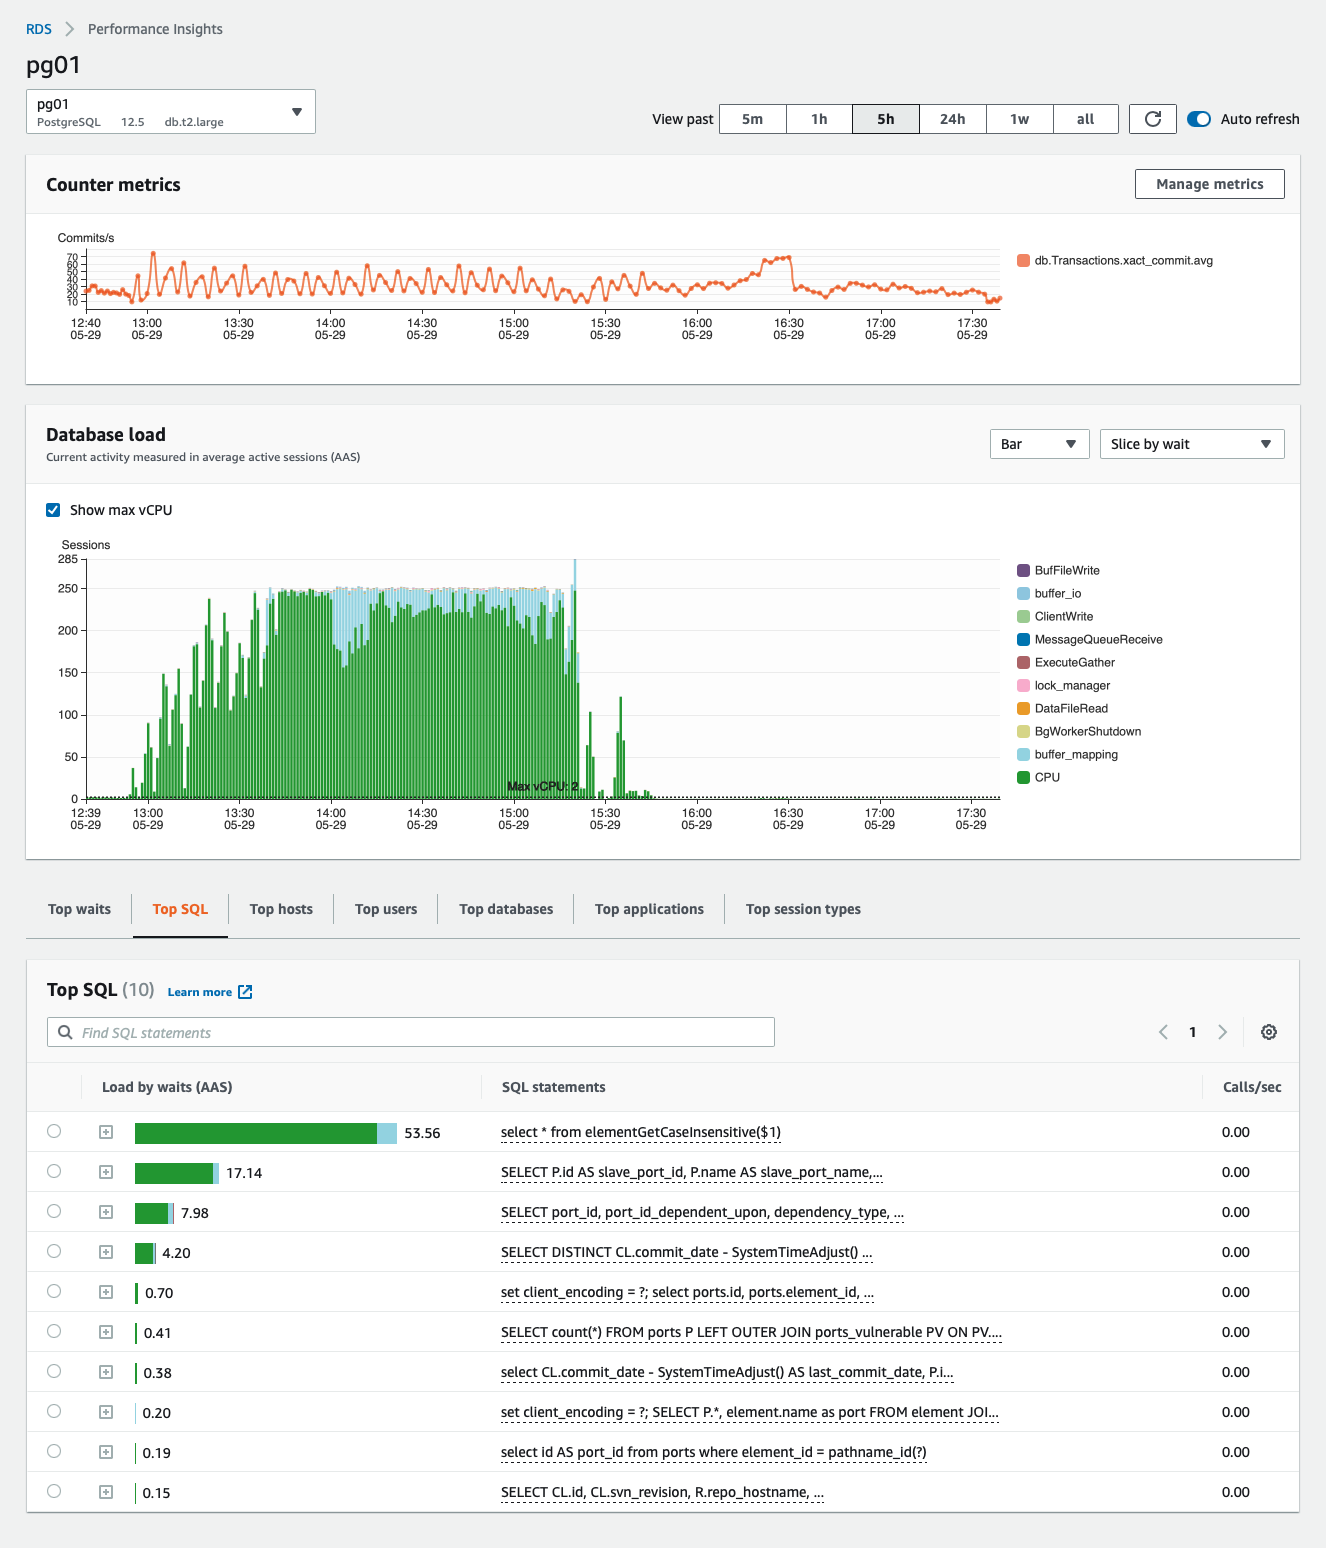
From this:
- select * from elementGetCaseInsensitive() is suspect
- this happened suddenly
The query
Here is the query:
   SELECT tmp.*, EP.pathname FROM (
      SELECT id,
             name::text,
             directory_file_flag::text,
             status::text,
             case when IsCategory(id) IS NULL THEN FALSE ELSE TRUE END,
             case when IsPort(    id) IS NULL THEN FALSE ELSE TRUE END
        FROM element
       WHERE id = (SELECT element_id
        FROM element_pathname
       WHERE lower(pathname) = lower($1))
     ) AS tmp JOIN element_pathname EP on tmp.id = EP.element_id;
And an explain analyse:
freshports.org=> explain analyse select * from elementGetCaseInsensitive('/ports/head/sysutils/nut');
                                                                       QUERY PLAN
--------------------------------------------------------------------------------------------------------------------------------------------------------
 Nested Loop  (cost=29669.04..29685.59 rows=1 width=137) (actual time=6396.216..6396.221 rows=1 loops=1)
   InitPlan 1 (returns $0)
     ->  Seq Scan on element_pathname  (cost=0.00..29668.18 rows=5748 width=4) (actual time=4123.990..6395.702 rows=1 loops=1)
           Filter: (lower(pathname) = '/ports/head/sysutils/nut'::text)
           Rows Removed by Filter: 1149267
   ->  Index Scan using element_pkey on element  (cost=0.43..8.45 rows=1 width=23) (actual time=6395.745..6395.746 rows=1 loops=1)
         Index Cond: (id = $0)
   ->  Index Scan using element_pathname_element_id on element_pathname ep  (cost=0.43..8.45 rows=1 width=56) (actual time=0.008..0.009 rows=1 loops=1)
         Index Cond: (element_id = $0)
 Planning Time: 0.392 ms
 Execution Time: 6396.252 ms
(11 rows)
That’s terrible. Look at that sequential scan on over 1.1 million rows.
I know how to improve this: a new index.
The alteration
This is how I altered the table, first, the original definition:
freshports.org-> \d element_pathname
            Table "public.element_pathname"
   Column   |  Type   | Collation | Nullable | Default
------------+---------+-----------+----------+---------
 element_id | integer |           | not null |
 pathname   | text    |           | not null |
Indexes:
    "element_pathname_pathname" UNIQUE, btree (pathname)
    "element_pathname_element_id" btree (element_id)
Foreign-key constraints:
    "element_pathname_element_id_fkey" FOREIGN KEY (element_id) REFERENCES element(id) ON DELETE CASCADE

freshports.org->
This is the index I added:
freshports.org=> begin;
BEGIN
freshports.org=> create index element_pathname_pathname_lc on element_pathname (lower(pathname));
CREATE INDEX
freshports.org=> commit;
The new explain analyze
Now that query runs quickly:
freshports.org=> explain analyse select * from elementGetCaseInsensitive('/ports/head/sysutils/nut');
                                                                       QUERY PLAN
--------------------------------------------------------------------------------------------------------------------------------------------------------
 Nested Loop  (cost=10438.60..10455.15 rows=1 width=137) (actual time=0.292..0.297 rows=1 loops=1)
   InitPlan 1 (returns $0)
     ->  Bitmap Heap Scan on element_pathname  (cost=265.08..10437.74 rows=5746 width=4) (actual time=0.042..0.043 rows=1 loops=1)
           Recheck Cond: (lower(pathname) = '/ports/head/sysutils/nut'::text)
           Heap Blocks: exact=1
           ->  Bitmap Index Scan on element_pathname_pathname_lc  (cost=0.00..263.65 rows=5746 width=0) (actual time=0.037..0.038 rows=1 loops=1)
                 Index Cond: (lower(pathname) = '/ports/head/sysutils/nut'::text)
   ->  Index Scan using element_pkey on element  (cost=0.43..8.45 rows=1 width=23) (actual time=0.053..0.054 rows=1 loops=1)
         Index Cond: (id = $0)
   ->  Index Scan using element_pathname_element_id on element_pathname ep  (cost=0.43..8.45 rows=1 width=56) (actual time=0.007..0.008 rows=1 loops=1)
         Index Cond: (element_id = $0)
 Planning Time: 0.604 ms
 Execution Time: 0.332 ms
(13 rows)

freshports.org=>
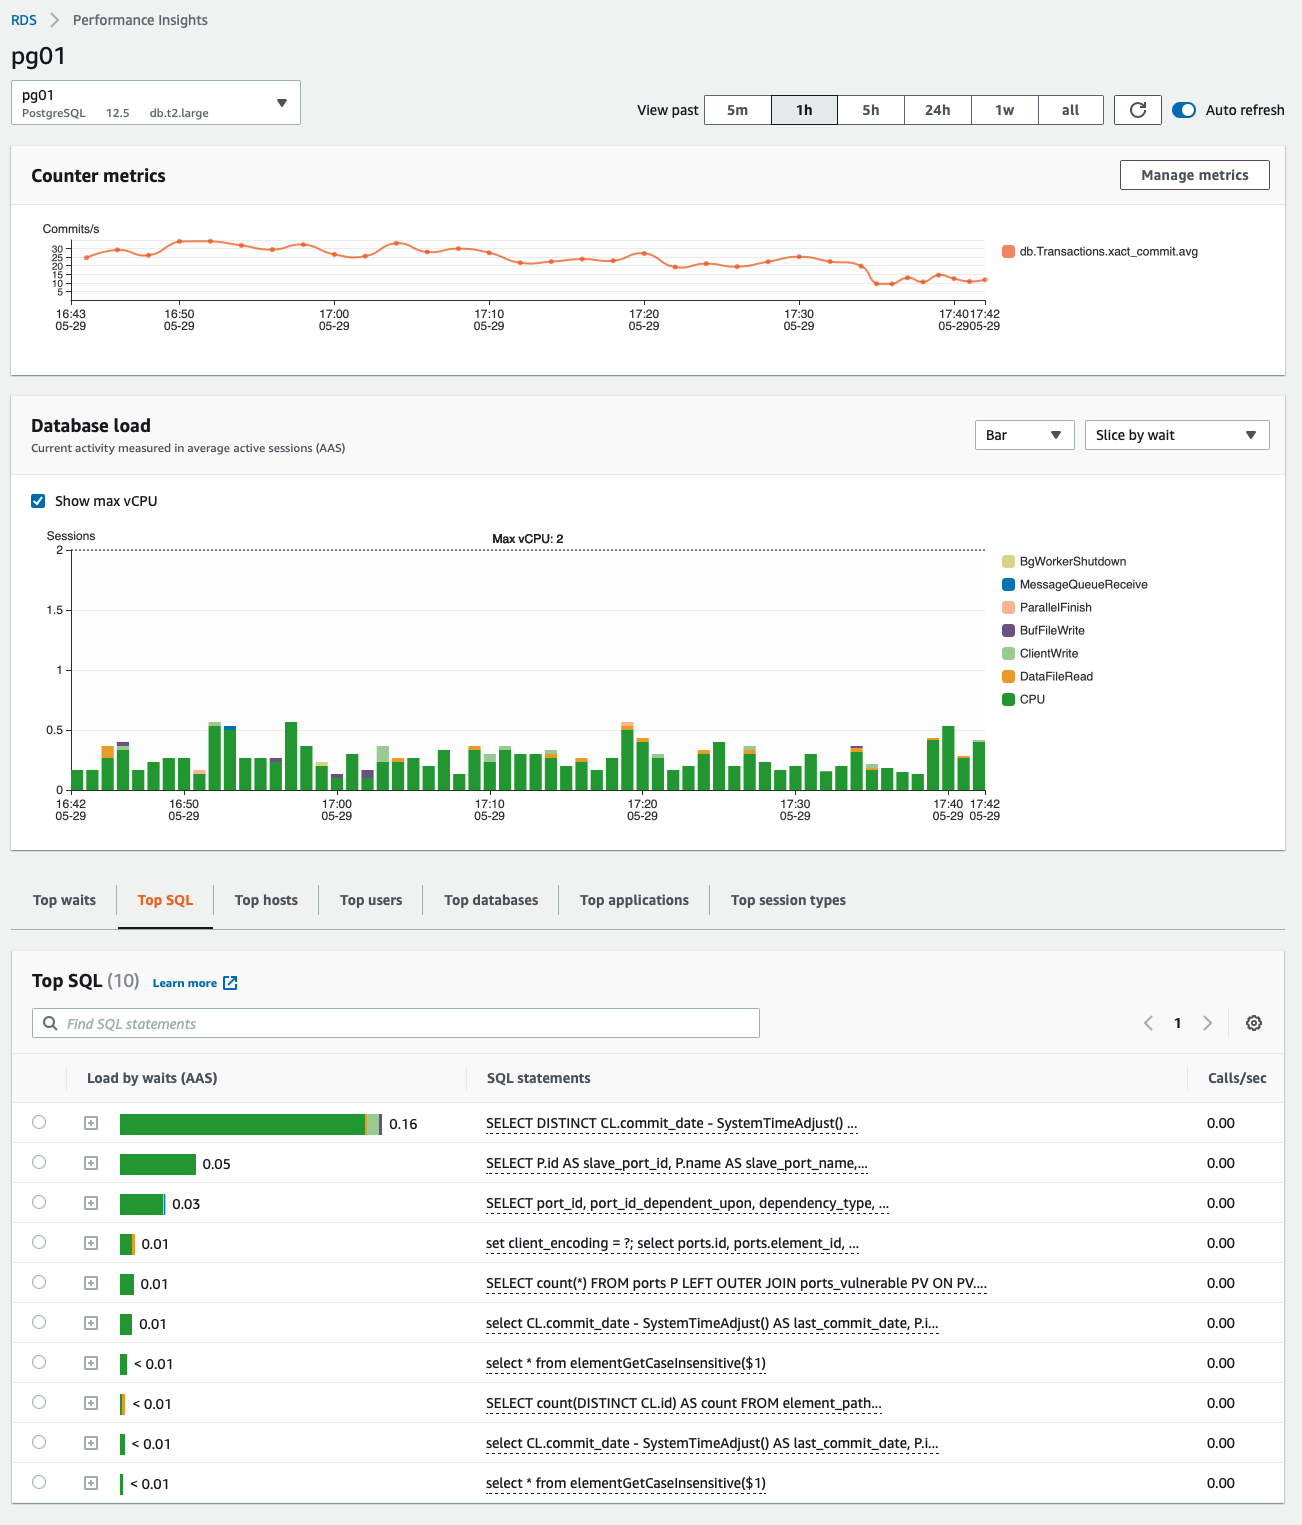
With that change, the website soon returned to its usually snappiness.
The stats show the results
This screen shows how the number of session is back to normal. see also that the query in question is now listed down under 0.01 seconds. Good.
I should have known to add this index with that new function was created. I don’t see an explain analyze in that post.


